> ## Documentation Index
> Fetch the complete documentation index at: https://docs.wavecentric.ai/llms.txt
> Use this file to discover all available pages before exploring further.
# KPI Dashboard
> Comprehensive business intelligence dashboard with real-time metrics and visualizations.
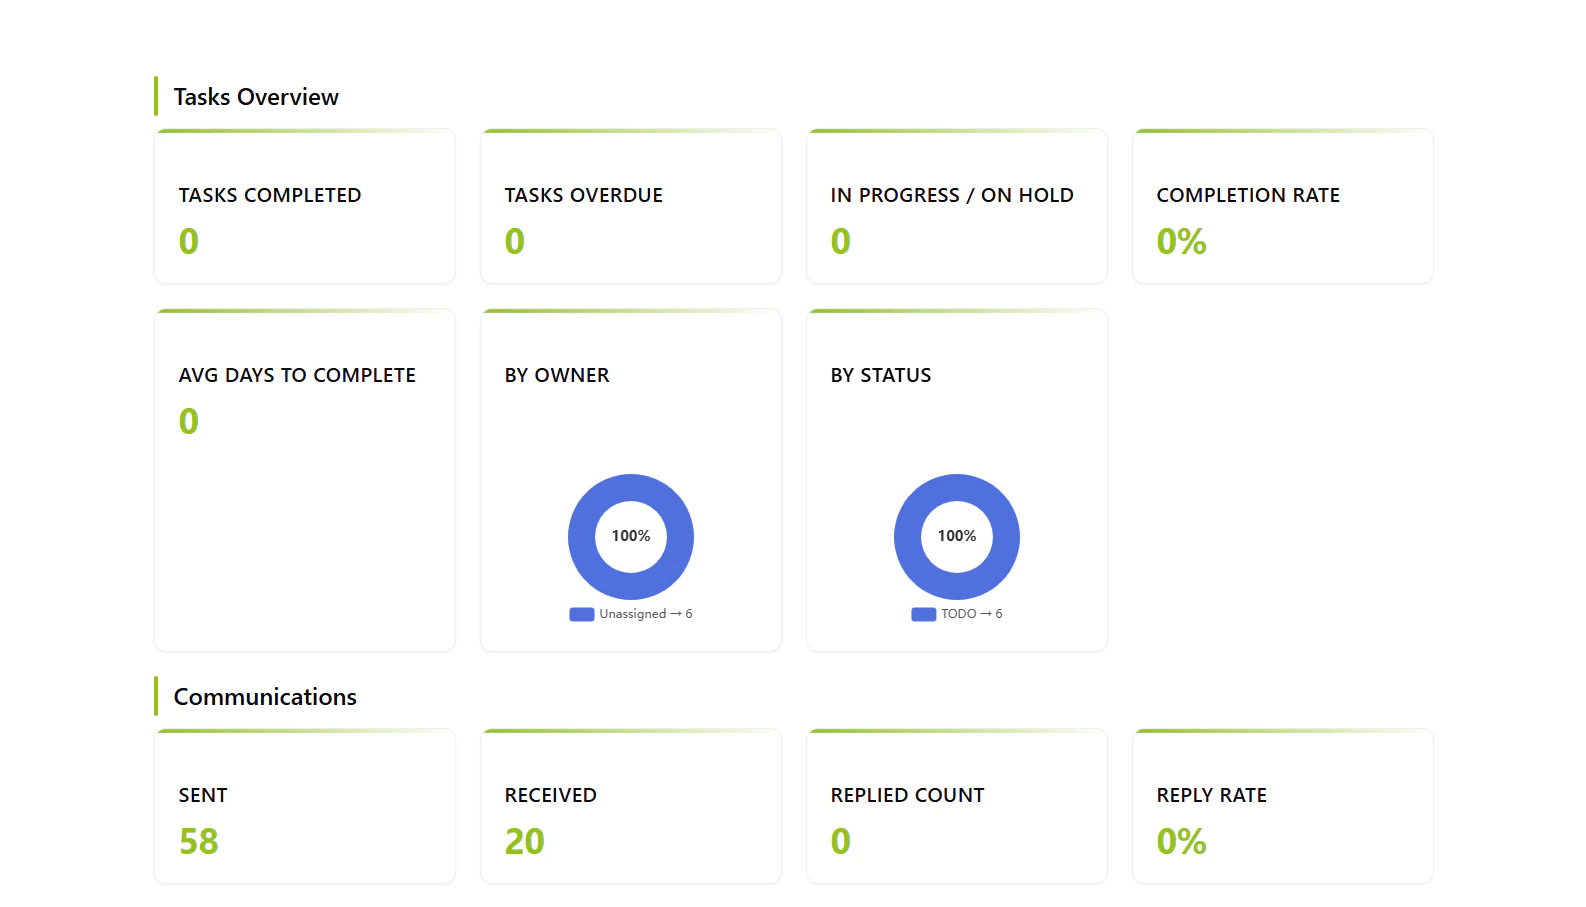
**KPI Dashboard** provides a comprehensive overview of business metrics across tasks, communications, customers, leads, and quotations with interactive visualizations and real-time data.
[Open KPI Dashboard →](https://ai-loop.alpeadria.com/ai-loop/flows?flow=kpi\&command=kpi)
 ## Workflow Visualization
```mermaid theme={null}
graph TD
User([User Requests KPI]) --> Parallel{Fetch Data
## Workflow Visualization
```mermaid theme={null}
graph TD
User([User Requests KPI]) --> Parallel{Fetch Data
in Parallel}
Parallel --> TasksKPI[Tasks KPI
Analysis]
Parallel --> CommKPI[Communications
KPI Analysis]
Parallel --> CustKPI[Customers KPI
Analysis]
Parallel --> LeadsKPI[Leads KPI
Analysis]
Parallel --> QuotesKPI[Quotations KPI
Analysis]
TasksKPI --> TaskMetrics[Calculate Metrics:
Completed, Overdue
Completion Rate
By Owner & Status]
CommKPI --> CommMetrics[Calculate Metrics:
Sent/Received
Reply Rates
Top Contacts]
CustKPI --> CustMetrics[Calculate Metrics:
Total Contacts
Funnel Status
New This Month]
LeadsKPI --> LeadMetrics[Calculate Metrics:
Total Leads
Conversion Rate]
QuotesKPI --> QuoteMetrics[Calculate Metrics:
Total Sent
Est. Value
By Status]
TaskMetrics --> Combine[Combine All Metrics]
CommMetrics --> Combine
CustMetrics --> Combine
LeadMetrics --> Combine
QuoteMetrics --> Combine
Combine --> Generate[Generate Interactive
Dashboard HTML]
Generate --> Display[Display with
ECharts Visualizations]
```
## What It Does
* **Real-Time Metrics**: Aggregates live data from multiple collections
* **Interactive Visualizations**: ECharts-powered doughnut charts and graphs
* **Comprehensive Overview**: Tasks, communications, customers, leads, and quotations
* **Performance Tracking**: Completion rates, reply rates, conversion rates
## Key Metrics
### Tasks
* Completed, overdue, and in-progress tasks
* Completion rate percentage
* Average time to complete (days)
* Activities by owner and status
### Communications
* Sent and received messages
* Reply rate and count
* Top 5 external contacts
* Not replied percentage
### Customers
* Total contacts and funnel distribution
* New contacts this month
* By funnel status (Default, Accepted, Draft, Sent, Expired, Rejected)
### Leads
* Total leads count
* Lead conversion rate percentage
### Quotations
* Total quotations sent
* Estimated cost this month
* Quotations by status (with breakdown)
## Commands
### KPI
Generates the complete business intelligence dashboard.
**No inputs required**
**Output:** Interactive HTML dashboard with all metrics and visualizations
## How to Use
### Open the Dashboard
Run the "KPI" command to generate the real-time business intelligence dashboard.
### Review Metrics
Explore the categorized sections: Tasks, Communications, Customers, Leads, and Quotations.
### Interact with Charts
Hover over doughnut charts to see detailed breakdowns and percentages for each metric.
## Technical Details
**Database:**
* Tasks: `datalake_main.db_ai-loop_V3_Tasks`
* Communications: `datalake_main.db_ai-loop_message_communication`
* Business: `datalake_main.db_ai-loop_V3_business`
* Requests: `datalake_main.db_ai-loop_V3_Requests`