> ## Documentation Index
> Fetch the complete documentation index at: https://docs.wavecentric.ai/llms.txt
> Use this file to discover all available pages before exploring further.
# Analytics & Reports
> Monitor business performance with real-time data visualizations.
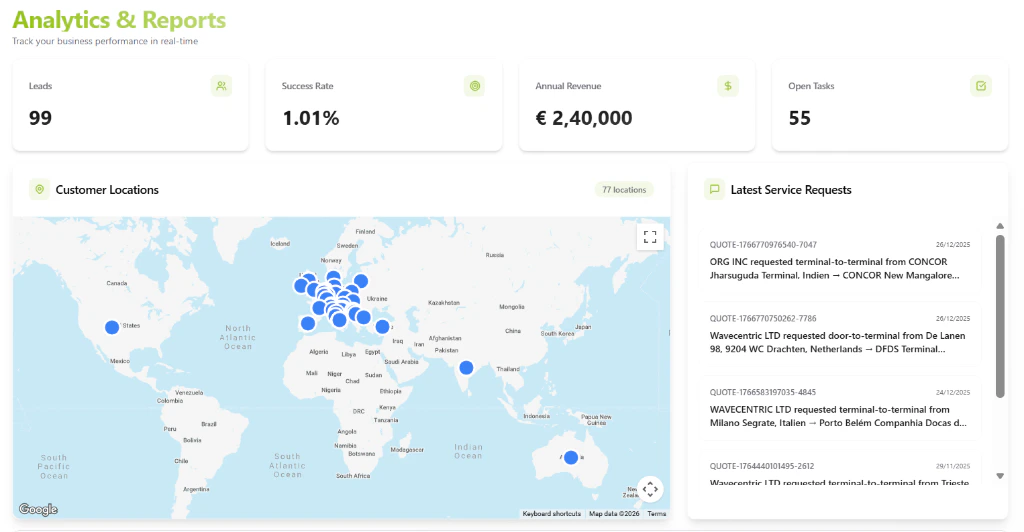
The **Analytics & Reports** module provides a high-level view of your business operations, helping you make data-driven decisions through interactive visualizations and real-time performance tracking.
## Key Performance Indicators (KPIs)
The dashboard features dynamic cards that track essential business metrics in real-time:
* **Leads**: Total volume of incoming inquiries and business opportunities.
* **Success Rate**: Percentage of successfully qualified or won leads.
* **Annual Revenue**: Total financial throughput generated by your logistics operations.
* **Open Tasks**: Current volume of pending activities requiring team attention.
## Geographic Intelligence
Visualize your global footprint with the interactive **Customer Locations** map:
* **Spatial Distribution**: Map-based visualization of your inquiries and customer base.
* **Interactive Geospatial Probes**: Powered by Google Maps, identifying exact coordinates for intermodal hubs and customer premises.
* **Regional Density**: Identify key market clusters and high-activity zones at a glance.
## Real-Time Operational Logging
Monitor the latest developments within your ecosystem:
* **Latest Service Requests**: A historical feed of incoming logistics requirements, including Quote IDs, customer names, and journey descriptions.
* **Instant Synchronization**: Every new inquiry or task update is immediately reflected in the analytics hub.