> ## Documentation Index
> Fetch the complete documentation index at: https://docs.wavecentric.ai/llms.txt
> Use this file to discover all available pages before exploring further.
# Stato Carri
> Visualize and summarize railway wagon data with interactive charts and AI-powered executive summaries.
The **Stato Carri** system provides powerful tools for analyzing and summarizing railway wagon data. Users can generate interactive bar charts grouped by any wagon attribute or create comprehensive AI-powered executive summaries of the entire fleet.
## Workflow Visualization
```mermaid theme={null}
graph TD
User([User Opens Fleet Status]) --> Choice{Select Action}
Choice -->|View By| SelectField[Select Grouping Field]
Choice -->|Summary| FetchAll[Fetch All Wagon Data]
SelectField --> Fields[Choose Field:
PESO, PORTATA, ASSI,
MODELLO, TIPO, etc.]
Fields --> Aggregate[Aggregate by Selected Field]
Aggregate --> Count[Count Records per Group]
Count --> GenerateChart[Generate ECharts Bar Chart]
GenerateChart --> ChartHTML[Interactive Chart Display]
FetchAll --> AllDocs[Retrieve All Wagon Documents]
AllDocs --> AIPrompt[Send to AI Model]
AIPrompt --> AISummary[Generate Executive Summary]
AISummary --> ConvertMD[Convert Markdown to HTML]
ConvertMD --> SummaryHTML[Formatted Summary Display]
```
## Key Features
### 1. View By - Interactive Data Visualization
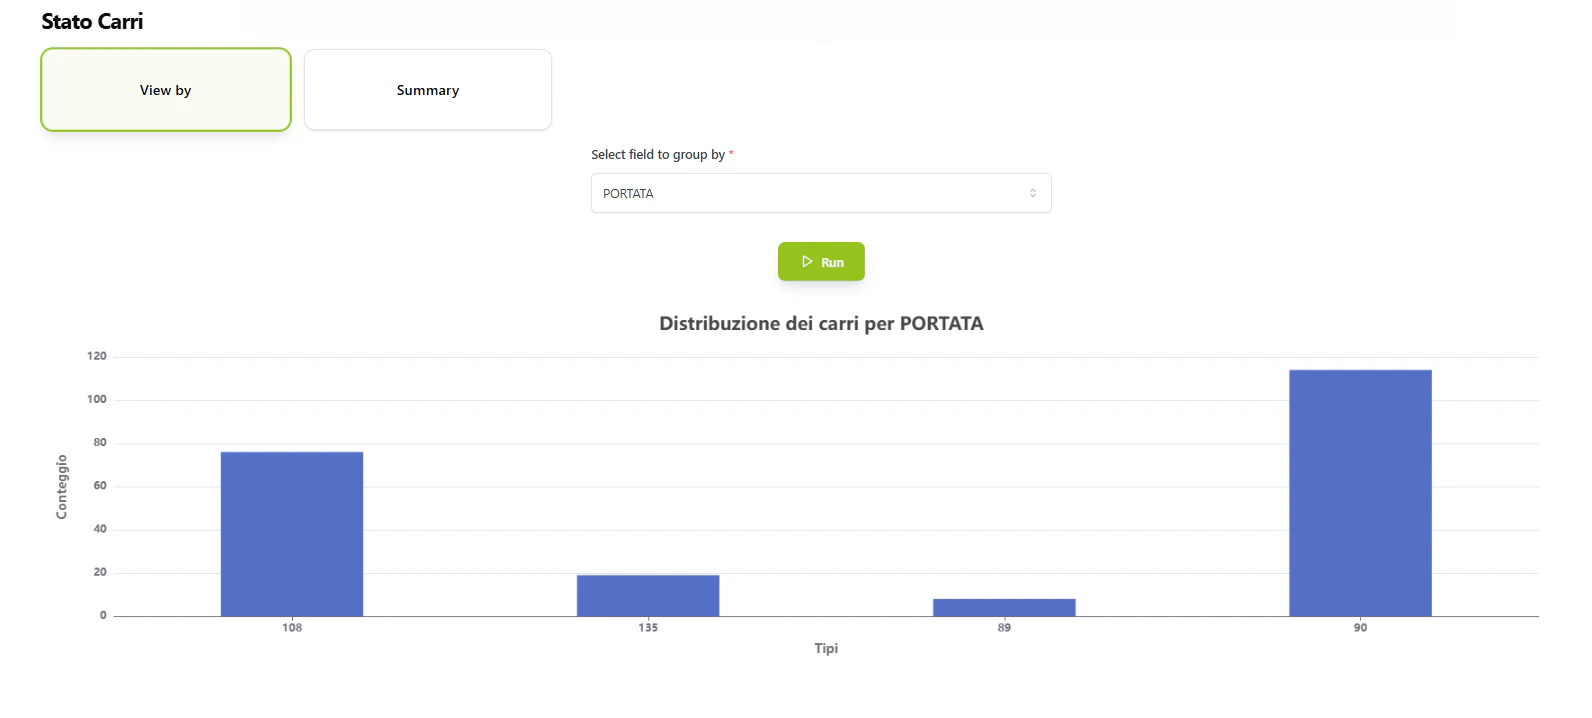
Generate dynamic bar charts to visualize wagon distribution across any attribute:
**Available Grouping Fields**:
* **PESO**: Weight distribution
* **PORTATA**: Capacity grouping
* **ASSI**: Axle configuration
* **LUNGHEZZA**: Length categories
* **MODELLO**: Model types
* **TIPO**: Wagon types
* **FORNITORE**: Supplier distribution
* **Wagon\_Keeper**: Keeper assignments
* **POSIZIONE**: Current positions
**Chart Features**:
* Interactive ECharts-powered visualization
* Automatic count aggregation per group
* Professional styling with customizable colors
* Responsive design with tooltips
* Clear axis labels and title
 [Open View By Chart →](https://ai-loop.alpeadria.com/ai-loop/flows?flow=stato-carri\&command=view-by\&View_by=)
### 2. Summary - AI-Powered Fleet Analysis
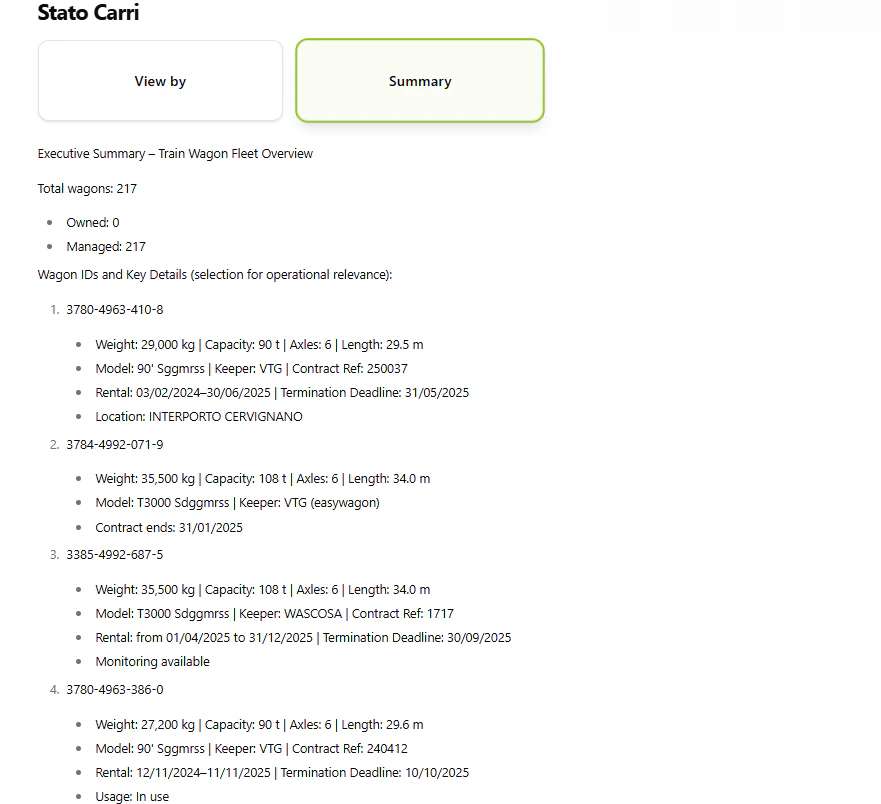
Generate comprehensive executive summaries using AI analysis:
**Summary Includes**:
* Total number of wagons (owned vs. managed breakdown)
* Complete list of wagon IDs (NUMEROVAGONE)
* Key operational details for each wagon
* Critical patterns and upcoming deadlines
* Management-relevant insights
**AI Processing**:
* Analyzes all wagon documents from `db_ai-loop_FLEET_carri`
* Extracts critical fields: ECM, ASSI, PESO, TIPO, MODELLO, PORTATA, contract details, and more
* Generates concise, professional summaries for quick decision-making
* Identifies time-sensitive information relative to current date
[Open View By Chart →](https://ai-loop.alpeadria.com/ai-loop/flows?flow=stato-carri\&command=view-by\&View_by=)
### 2. Summary - AI-Powered Fleet Analysis
Generate comprehensive executive summaries using AI analysis:
**Summary Includes**:
* Total number of wagons (owned vs. managed breakdown)
* Complete list of wagon IDs (NUMEROVAGONE)
* Key operational details for each wagon
* Critical patterns and upcoming deadlines
* Management-relevant insights
**AI Processing**:
* Analyzes all wagon documents from `db_ai-loop_FLEET_carri`
* Extracts critical fields: ECM, ASSI, PESO, TIPO, MODELLO, PORTATA, contract details, and more
* Generates concise, professional summaries for quick decision-making
* Identifies time-sensitive information relative to current date
 ## Workflow Details
### 1. User Selects Action
User accesses the Fleet Status feature and chooses between:
* **View By**: Generate visual charts
* **Summary**: Get AI-powered analysis
### 2a. View By - Chart Generation
**User Action**: Select a field to group by (e.g., "TIPO" for wagon types)
**System Process**:
1. Queries `db_ai-loop_FLEET_carri` collection
2. Performs MongoDB aggregation: groups by selected field and counts records
3. Sorts results by field value
4. Generates ECharts configuration with:
* X-axis: Field values (wagon types, models, etc.)
* Y-axis: Count of wagons
* Title: "Distribuzione dei carri per \[Field]"
5. Returns interactive HTML chart
**Output**: Interactive bar chart showing distribution of wagons across the selected attribute
### 2b. Summary - AI Analysis
**System Process**:
1. Fetches all documents from `db_ai-loop_FLEET_carri` with projection:
* Wagon identifiers: NUMEROVAGONE, ECM
* Physical attributes: ASSI, PESO, TIPO, MODELLO, PORTATA, LUNGHEZZA
* Operational data: POSIZIONE, monitoring, Wagon\_Keeper
* Contract info: FORNITORE, Rif\_Contratto, INIZIO\_NOLEGGIO, Termine\_Disdetta
* Maintenance: Scadenza, KM\_rimanenti, Eventuali\_limitazioni\_Km
* Special equipment: Special\_Equipment\_POWER\_BOX, Special\_Equipment\_ALTRO
2. Sends data to AI with specialized logistics prompt
3. AI analyzes and generates summary covering:
* Total wagon count (owned vs. managed)
* Wagon IDs and key details
* Critical patterns and deadlines
4. Converts markdown response to HTML
5. Returns formatted executive summary
**Output**: Professional HTML summary ready for management review
### 3. Display Results
* **Charts**: Rendered in browser with full interactivity (hover tooltips, zoom, etc.)
* **Summary**: Displayed as formatted HTML with proper headings and structure
* Both outputs are optimized for quick scanning and decision-making
## Use Cases
### Operations Management
* **Quick Distribution Check**: Use "View By TIPO" to see wagon type distribution
* **Supplier Analysis**: Group by "FORNITORE" to analyze supplier allocation
* **Location Overview**: View by "POSIZIONE" to understand fleet positioning
### Executive Reporting
* **Fleet Status Report**: Generate AI summary for weekly management meetings
* **Contract Review**: Summary highlights upcoming contract deadlines and renewal dates
* **Maintenance Planning**: AI identifies wagons approaching service limits
### Strategic Planning
* **Capacity Analysis**: View by "PORTATA" to understand capacity distribution
* **Model Assessment**: Group by "MODELLO" to analyze fleet composition
* **Keeper Allocation**: View by "Wagon\_Keeper" to review keeper assignments
## Workflow Details
### 1. User Selects Action
User accesses the Fleet Status feature and chooses between:
* **View By**: Generate visual charts
* **Summary**: Get AI-powered analysis
### 2a. View By - Chart Generation
**User Action**: Select a field to group by (e.g., "TIPO" for wagon types)
**System Process**:
1. Queries `db_ai-loop_FLEET_carri` collection
2. Performs MongoDB aggregation: groups by selected field and counts records
3. Sorts results by field value
4. Generates ECharts configuration with:
* X-axis: Field values (wagon types, models, etc.)
* Y-axis: Count of wagons
* Title: "Distribuzione dei carri per \[Field]"
5. Returns interactive HTML chart
**Output**: Interactive bar chart showing distribution of wagons across the selected attribute
### 2b. Summary - AI Analysis
**System Process**:
1. Fetches all documents from `db_ai-loop_FLEET_carri` with projection:
* Wagon identifiers: NUMEROVAGONE, ECM
* Physical attributes: ASSI, PESO, TIPO, MODELLO, PORTATA, LUNGHEZZA
* Operational data: POSIZIONE, monitoring, Wagon\_Keeper
* Contract info: FORNITORE, Rif\_Contratto, INIZIO\_NOLEGGIO, Termine\_Disdetta
* Maintenance: Scadenza, KM\_rimanenti, Eventuali\_limitazioni\_Km
* Special equipment: Special\_Equipment\_POWER\_BOX, Special\_Equipment\_ALTRO
2. Sends data to AI with specialized logistics prompt
3. AI analyzes and generates summary covering:
* Total wagon count (owned vs. managed)
* Wagon IDs and key details
* Critical patterns and deadlines
4. Converts markdown response to HTML
5. Returns formatted executive summary
**Output**: Professional HTML summary ready for management review
### 3. Display Results
* **Charts**: Rendered in browser with full interactivity (hover tooltips, zoom, etc.)
* **Summary**: Displayed as formatted HTML with proper headings and structure
* Both outputs are optimized for quick scanning and decision-making
## Use Cases
### Operations Management
* **Quick Distribution Check**: Use "View By TIPO" to see wagon type distribution
* **Supplier Analysis**: Group by "FORNITORE" to analyze supplier allocation
* **Location Overview**: View by "POSIZIONE" to understand fleet positioning
### Executive Reporting
* **Fleet Status Report**: Generate AI summary for weekly management meetings
* **Contract Review**: Summary highlights upcoming contract deadlines and renewal dates
* **Maintenance Planning**: AI identifies wagons approaching service limits
### Strategic Planning
* **Capacity Analysis**: View by "PORTATA" to understand capacity distribution
* **Model Assessment**: Group by "MODELLO" to analyze fleet composition
* **Keeper Allocation**: View by "Wagon\_Keeper" to review keeper assignments