> ## Documentation Index
> Fetch the complete documentation index at: https://docs.wavecentric.ai/llms.txt
> Use this file to discover all available pages before exploring further.
# CCM 11 - Service Performance Monitoring
> Real-time monitoring of service performance and identification of areas for improvement.
## 1. Overview
Service Performance Monitoring provides the operational pulse of the platform. It fulfills the requirement to "monitor service performance in real-time", enabling the business not only to react to issues but to proactively identify inefficiencies in both customer management and procurement processes.
## 2. Scope and Business Meaning
Functionally, this deliverable covers the **efficiency optimization** layer. It ensures:
* **Operational Visibility**: Instant insight into the volume and status of ongoing service requests.
* **Process Health**: Identifying bottlenecks by tracking "Open Tasks" and conversion rates.
* **Strategic Alignment**: Using data to align procurement strategies with actual customer demand patterns.
## 3. Implemented Functionalities
The platform implements the following functionalities to fulfill the "service performance monitoring" requirement.
### Real-time Operational Metrics
**Requirement Addressed**: *"Monitor service performance in real time"*
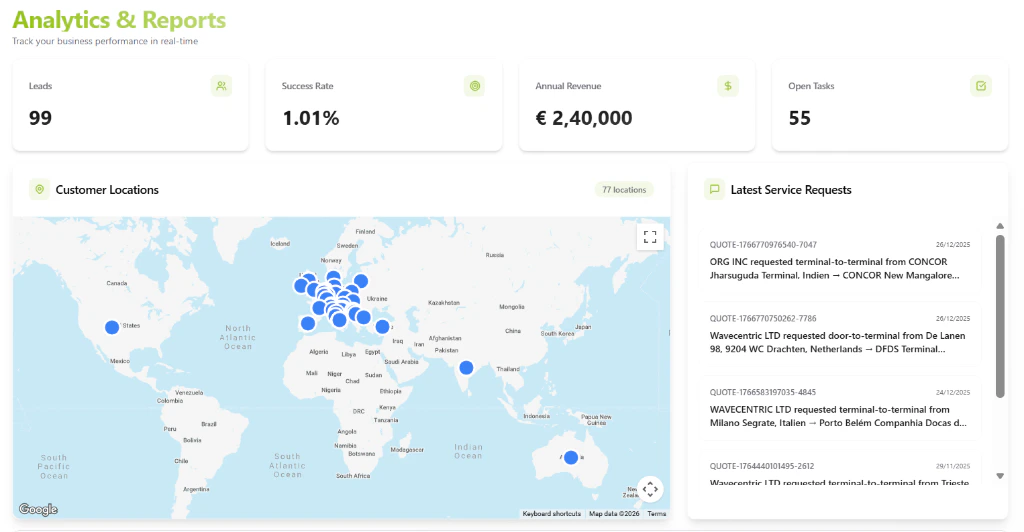
The **Analytics & Reports** dashboard serves as the central monitoring station:
* **Throughput Tracking**: The **Leads** and **Annual Revenue** KPIs provide a real-time gauge of business volume and financial performance.
* **Efficiency Indicators**: The **Success Rate** metric highlights the effectiveness of the commercial team in converting inquiries to contracts.
Refer: [Analytics & Reports](/functionalities/analytics-reports)
### Optimization Intelligence
**Requirement Addressed**: *"Identify any areas for improvement... in procurement"*
By visualizing data spatially and temporally, the system highlights inefficiencies:
* **Demand Heatmaps**: The **Customer Locations** map reveals geographic clusters of high activity, allowing for optimized procurement of carrier capacity in those regions.
* **Bottleneck Detection**: The **Open Tasks** metric identifies backlogs in the execution pipeline, signaling areas where resource allocation needs improvement.
## 4. Technical Enablement
The platform enables this deliverable through:
### Streaming Analytics
* **`StreamProcessor`**: A backend component that ingests events (e.g., "Inquiry Created", "Task Completed") in real-time.
* **Aggregation Pipeline**: Pre-calculates performance metrics every 60 seconds to ensure dashboard dashboards are always reflective of the current state.
## 5. Evidence of Delivery
The following evidence demonstrates strict compliance with the CCM 11 requirement:
| Capability | Verification Evidence |
| :--------------------------- | :------------------------------------------------------------------------------------------------------------------------------------------------------------ |
| **Performance Monitoring** | **Evidenced by \[KPI Dashboard]**: The live metrics for Revenue, Leads, and Success Rate prove the system's ability to track core service performance. |
| **Inefficiency Detection** | **Evidenced by \[Open Tasks Counter]**: The explicit tracking of pending tasks allows management to instantly identify operational bottlenecks. |
| **Procurement Optimization** | **Evidenced by \[Geographic Intelligence]**: The ability to match demand (Inquiries) with supply (Network Map) allows for data-driven procurement strategies. |