> ## Documentation Index
> Fetch the complete documentation index at: https://docs.wavecentric.ai/llms.txt
> Use this file to discover all available pages before exploring further.
# MCD 04 - Analytical Tools
> Monitor and optimize logistics performance using advanced analytics tools.
## 1. Overview
**Analytical Tools to Monitor and Optimize Logistics Performance** provides the intelligence layer for the Multimodal Chain Design. It fulfills the requirement to "provide advanced analytics tools to monitor the performance of logistics operations, identifying any bottlenecks and areas for continuous improvement."
This capability is crucial to improving efficiency and reducing operational costs through deep logistics performance analysis.
## 2. Scope and Business Meaning
Functionally, this deliverable covers the **Performance Intelligence & Optimization** layer. It ensures:
* **Operational Visibility**: Continuous monitoring of key performance indicators (KPIs) to gauge business health.
* **Bottleneck Identification**: Pinpointing areas of friction, such as stalled tasks or geographic service gaps.
* **Strategic Decision Support**: Data-driven insights to optimize resource allocation and improve service delivery.
## 3. Implemented Functionalities
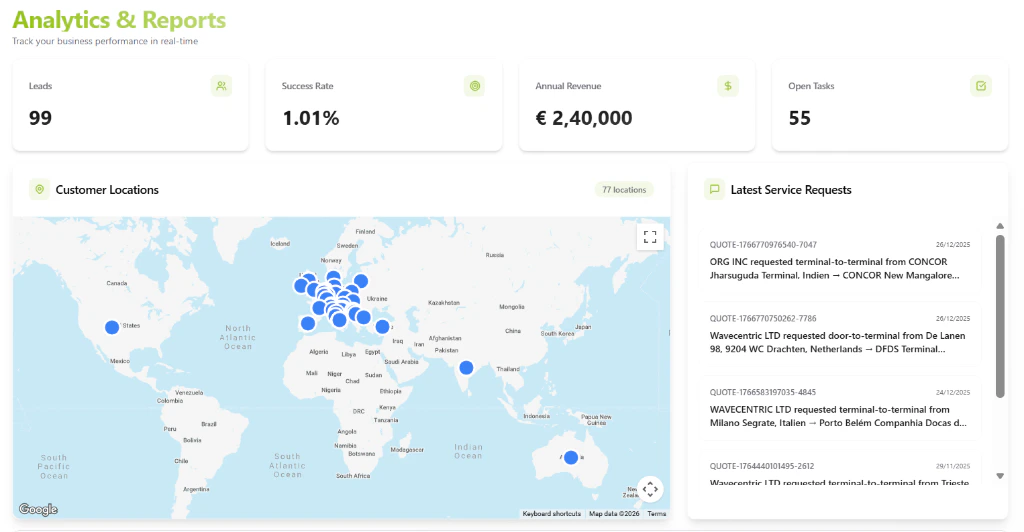
The platform implements "Analytical Tools" through the **Analytics & Reports** module, providing real-time visualization of critical business metrics.
### Key Performance Indicators (KPIs)
**Requirement Addressed**: *"Monitor the performance of logistics operations"*
The dashboard provides instant visibility into high-level metrics:
* **Commercial Performance**: Track **Leads**, **Success Rate**, and **Annual Revenue** to monitor business growth and conversion efficiency.
* **Operational Load**: Monitor **Open Tasks** to identify bottlenecks in workforce capacity and task resolution.
### Geographic Intelligence
**Requirement Addressed**: *"Identifying areas for continuous improvement"*
Advanced mapping tools allow for spatial analysis of logistics demand:
* **Spatial Distribution**: Visualize the density of inquiries and customers across regions.
* **Market Clustering**: Identify high-activity zones to optimize forward positioning of assets or partner networks.
### Real-Time Operational Logging
**Requirement Addressed**: *"Identifying any bottlenecks"*
A live feed of **Latest Service Requests** ensures that no inquiry goes unnoticed, allowing managers to spot untreated requests immediately.
Refer: [Analytics & Reports](/functionalities/analytics-reports)
 ## 4. Technical Enablement
The platform enables this deliverable through:
### Real-Time Aggregation Engine
* **Instant Synchronization**: The analytical engine is event-driven, ensuring that every new inquiry, task update, or status change is immediately reflected in the dashboard without polling latency.
* **Geospatial Visualization**: Integration with mapping services to render complex location data into actionable visual insights.
## 5. Evidence of Delivery
The following evidence demonstrates strict compliance with the MCD 04 requirement:
| Capability | Verification Evidence |
| :---------------------------- | :------------------------------------------------------------------------------------------------------------------------------------------------------------------ |
| **Performance Monitoring** | **Evidenced by \[Live KPIs]**: The active tracking of Leads, Revenue, and Task volumes proves the system's ability to monitor operational performance in real-time. |
| **Bottleneck Identification** | **Evidenced by \[Open Task Tracking]**: The specific metric for "Open Tasks" serves as a direct indicator of operational bottlenecks requiring attention. |
| **Continuous Improvement** | **Evidenced by \[Geographic Insights]**: The "Customer Locations" map provides the spatial data necessary to optimize network coverage and improve service reach. |
## 4. Technical Enablement
The platform enables this deliverable through:
### Real-Time Aggregation Engine
* **Instant Synchronization**: The analytical engine is event-driven, ensuring that every new inquiry, task update, or status change is immediately reflected in the dashboard without polling latency.
* **Geospatial Visualization**: Integration with mapping services to render complex location data into actionable visual insights.
## 5. Evidence of Delivery
The following evidence demonstrates strict compliance with the MCD 04 requirement:
| Capability | Verification Evidence |
| :---------------------------- | :------------------------------------------------------------------------------------------------------------------------------------------------------------------ |
| **Performance Monitoring** | **Evidenced by \[Live KPIs]**: The active tracking of Leads, Revenue, and Task volumes proves the system's ability to monitor operational performance in real-time. |
| **Bottleneck Identification** | **Evidenced by \[Open Task Tracking]**: The specific metric for "Open Tasks" serves as a direct indicator of operational bottlenecks requiring attention. |
| **Continuous Improvement** | **Evidenced by \[Geographic Insights]**: The "Customer Locations" map provides the spatial data necessary to optimize network coverage and improve service reach. |