> ## Documentation Index
> Fetch the complete documentation index at: https://docs.wavecentric.ai/llms.txt
> Use this file to discover all available pages before exploring further.
# MCD 10 - Real-Time Performance Monitoring
> Monitor logistics operations in real-time with KPIs and key performance indicators.
## 1. Overview
**Real-Time Performance Monitoring** is the operational intelligence layer that provides continuous visibility into logistics performance. It fulfills the requirement to "allow users to monitor the performance of logistics operations in real time, showing KPIs and key indicators, such as delivery times, costs and efficiency."
This is **useful for having a detailed view of the progress of operations and making data-driven decisions** to optimize logistics efficiency.
## 2. Scope and Business Meaning
Functionally, this deliverable covers the **Business Intelligence & Analytics** layer. It ensures:
* **Real-Time Visibility**: Instant access to current operational metrics across all business areas.
* **Performance Tracking**: Continuous monitoring of key performance indicators for tasks, communications, customers, leads, and quotations.
* **Data-Driven Decisions**: Comprehensive metrics enabling informed strategic and tactical decisions.
## 3. Implemented Functionalities
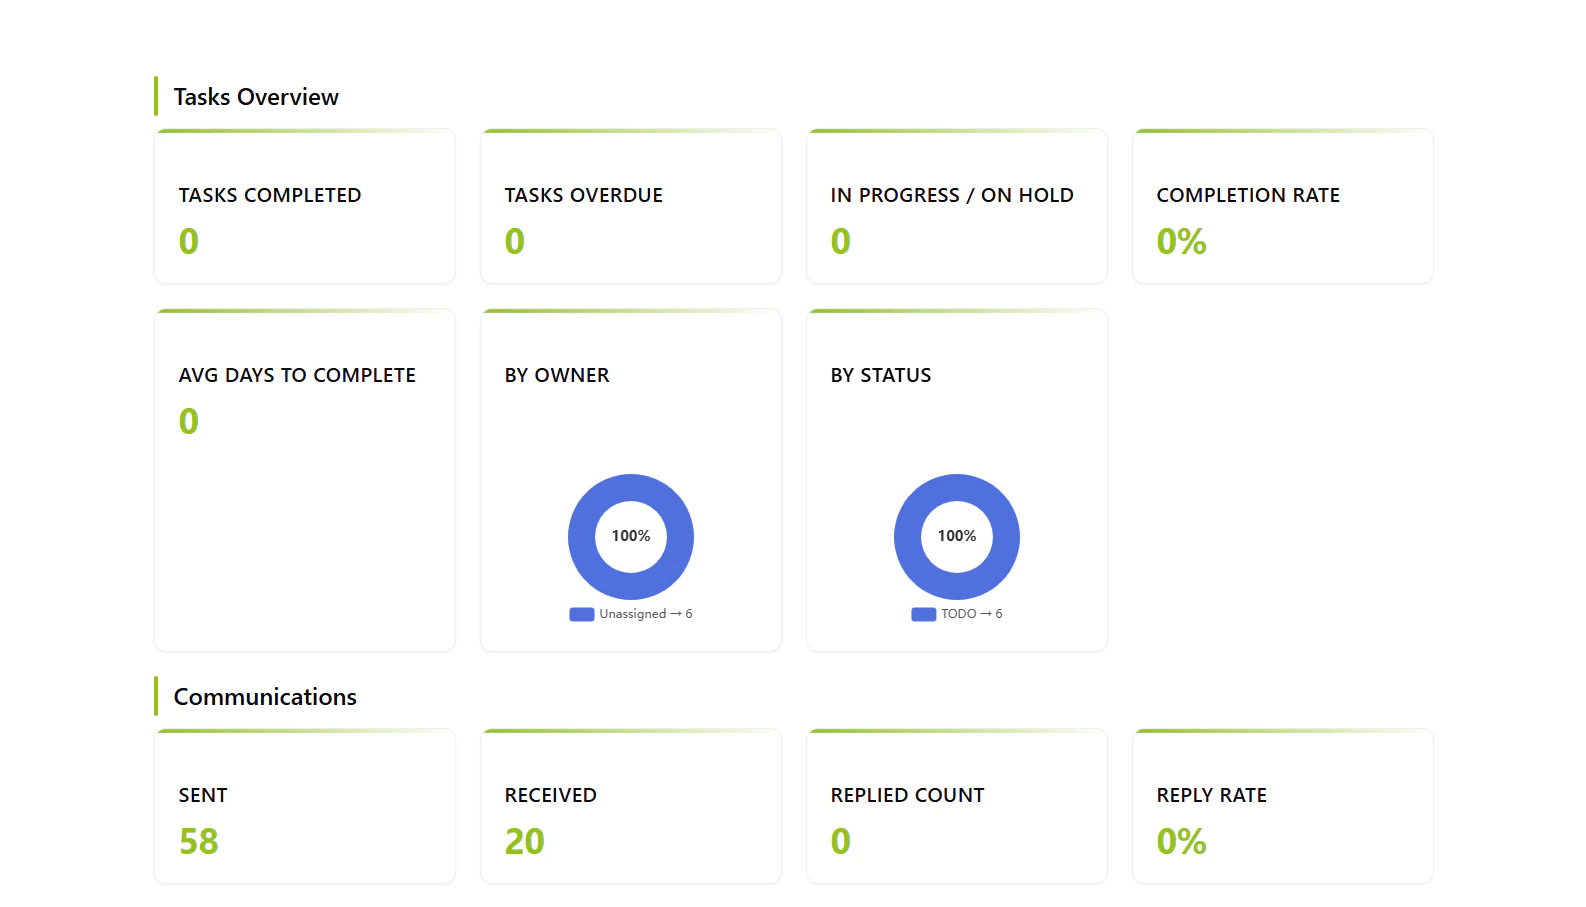
The platform implements "Real-Time Performance Monitoring" through the **KPI Dashboard**, which provides comprehensive business intelligence across five critical operational areas.
### Tasks Performance Monitoring
**Requirement Addressed**: *"Monitor the performance of logistics operations"*
The system tracks task execution and completion metrics in real-time:
* **Completion Tracking**: Completed, overdue, and in-progress tasks with completion rate percentage.
* **Time Analysis**: Average time to complete tasks measured in days.
* **Owner Distribution**: Activities breakdown by task owner and current status.
Refer: [KPI Dashboard](/flows/kpi)
### Communications Analytics
**Requirement Addressed**: *"Showing KPIs and key indicators"*
Real-time monitoring of communication efficiency:
* **Message Volume**: Sent and received messages tracked continuously.
* **Reply Metrics**: Reply rate percentage and response count analysis.
* **Contact Analysis**: Top 5 external contacts and not-replied percentage tracking.
### Customer Intelligence
**Requirement Addressed**: *"Detailed view of the progress of operations"*
Comprehensive customer relationship metrics:
* **Contact Management**: Total contacts and funnel distribution tracking.
* **Growth Analysis**: New contacts this month with trend analysis.
* **Funnel Progression**: Distribution by status (Default, Accepted, Draft, Sent, Expired, Rejected).
### Lead Performance Tracking
**Requirement Addressed**: *"Monitor efficiency"*
Lead generation and conversion monitoring:
* **Lead Volume**: Total leads count with real-time updates.
* **Conversion Metrics**: Lead conversion rate percentage for efficiency analysis.
### Quotation Monitoring
**Requirement Addressed**: *"Showing... costs"*
Financial and quotation performance tracking:
* **Quotation Volume**: Total quotations sent with status breakdown.
* **Cost Analysis**: Estimated cost this month tracking.
* **Status Distribution**: Quotations by status for pipeline visibility.
 ## 4. Technical Enablement
The platform enables this deliverable through:
### Real-Time Data Aggregation
* **Parallel Processing**: Multiple database queries executed simultaneously for instant dashboard generation.
* **Live Calculations**: Metrics computed on-demand from current database state ensuring real-time accuracy.
* **Interactive Visualizations**: ECharts 5.5.0 providing professional doughnut charts and graphs with hover interactions.
### Data Sources Integration
The dashboard aggregates data from centralized collections:
* **Tasks**: `datalake_main.db_ai-loop_V3_Tasks`
* **Communications**: `datalake_main.db_ai-loop_message_communication`
* **Business**: `datalake_main.db_ai-loop_V3_business`
* **Requests**: `datalake_main.db_ai-loop_V3_Requests`
**Access Point:**
[Open KPI Dashboard →](https://ai-loop.alpeadria.com/ai-loop/flows?flow=kpi\&command=kpi)
## 5. Evidence of Delivery
The following evidence demonstrates strict compliance with the MCD 10 requirement:
| Capability | Verification Evidence |
| :------------------------- | :------------------------------------------------------------------------------------------------------------------------------------------------------------------------------------------------------------------- |
| **Real-Time Monitoring** | **Evidenced by \[Live Dashboard]**: The KPI Dashboard executes real-time queries across all operational databases, displaying current metrics without caching or delays. |
| **Performance KPIs** | **Evidenced by \[Comprehensive Metrics]**: The dashboard displays completion rates (tasks), reply rates (communications), conversion rates (leads), and cost estimates (quotations) as specified in the requirement. |
| **Operational Visibility** | **Evidenced by \[Multi-Area Coverage]**: The interface (shown above) proves the system monitors all critical logistics areas: task execution, customer interactions, lead progression, and quotation pipeline. |
## 4. Technical Enablement
The platform enables this deliverable through:
### Real-Time Data Aggregation
* **Parallel Processing**: Multiple database queries executed simultaneously for instant dashboard generation.
* **Live Calculations**: Metrics computed on-demand from current database state ensuring real-time accuracy.
* **Interactive Visualizations**: ECharts 5.5.0 providing professional doughnut charts and graphs with hover interactions.
### Data Sources Integration
The dashboard aggregates data from centralized collections:
* **Tasks**: `datalake_main.db_ai-loop_V3_Tasks`
* **Communications**: `datalake_main.db_ai-loop_message_communication`
* **Business**: `datalake_main.db_ai-loop_V3_business`
* **Requests**: `datalake_main.db_ai-loop_V3_Requests`
**Access Point:**
[Open KPI Dashboard →](https://ai-loop.alpeadria.com/ai-loop/flows?flow=kpi\&command=kpi)
## 5. Evidence of Delivery
The following evidence demonstrates strict compliance with the MCD 10 requirement:
| Capability | Verification Evidence |
| :------------------------- | :------------------------------------------------------------------------------------------------------------------------------------------------------------------------------------------------------------------- |
| **Real-Time Monitoring** | **Evidenced by \[Live Dashboard]**: The KPI Dashboard executes real-time queries across all operational databases, displaying current metrics without caching or delays. |
| **Performance KPIs** | **Evidenced by \[Comprehensive Metrics]**: The dashboard displays completion rates (tasks), reply rates (communications), conversion rates (leads), and cost estimates (quotations) as specified in the requirement. |
| **Operational Visibility** | **Evidenced by \[Multi-Area Coverage]**: The interface (shown above) proves the system monitors all critical logistics areas: task execution, customer interactions, lead progression, and quotation pipeline. |