Key Features
1. Interactive Geospatial Map
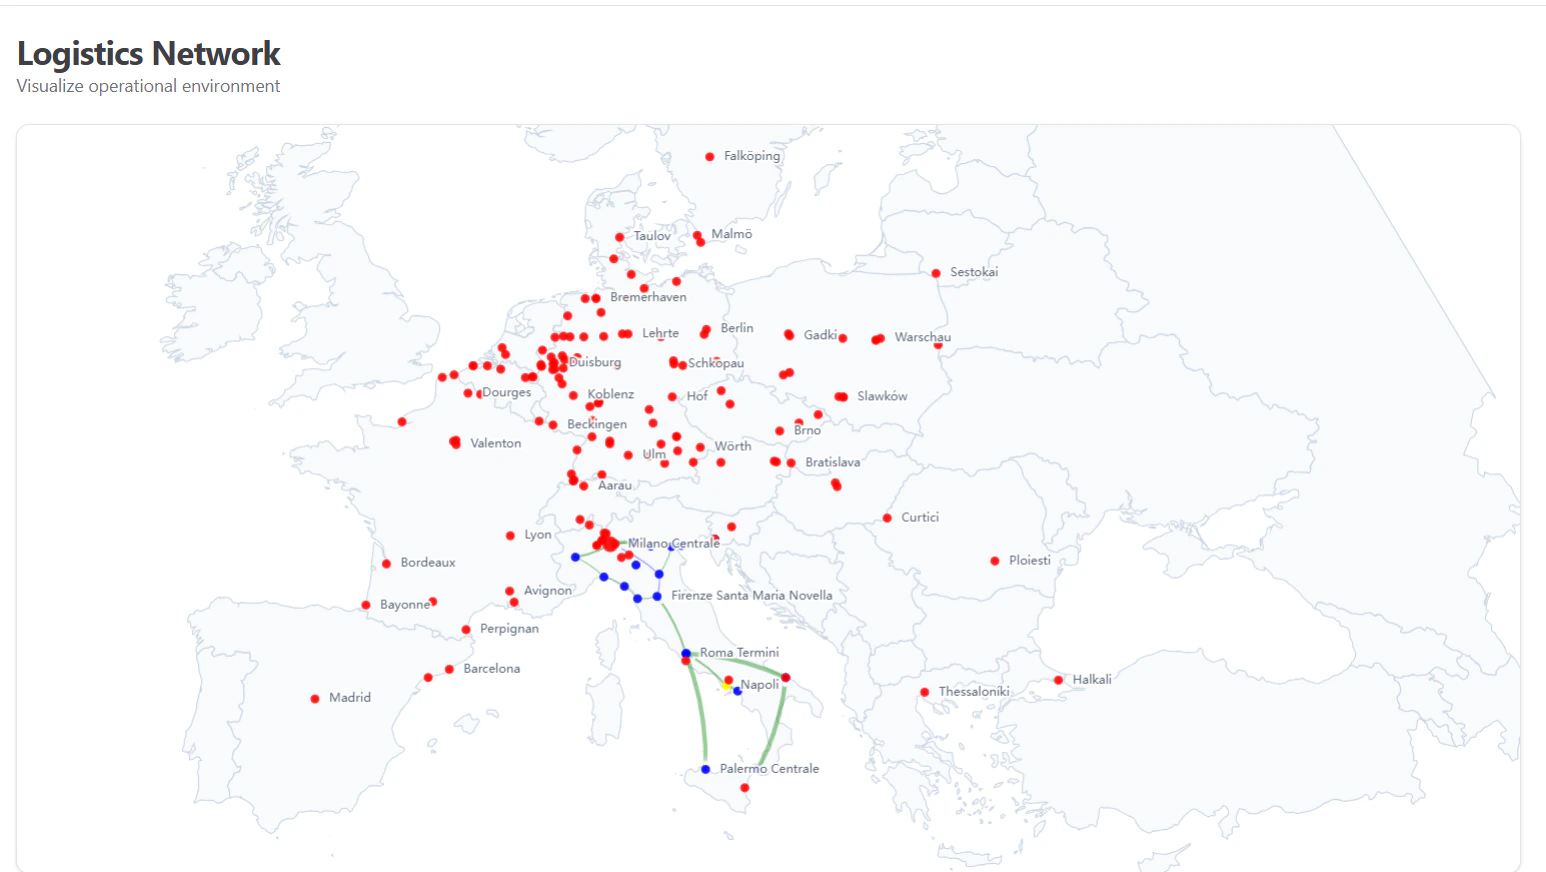
The core of this module is a dynamic map of Europe that supports:- Pan & Zoom: Users can roam freely across the map to focus on specific regions (e.g., Northern Italy, Central Europe).
- Auto-Fit: On load, the map automatically centers on the active network cluster.
- Theme Adaptation: The map’s cartography (borders, land mass colors) automatically adjusts to light or dark mode for optimal readability.
2. Node Visualization (Hubs & Terminals)
Locations are represented as interactive nodes.- Visual Hierachy: Node size changes dynamically based on importance or “weight” (e.g., volume of traffic).
- Smart Labeling: Labels automatically position themselves to avoid overlap and improve clarity.
- Rich Tooltips: Hovering over a node reveals:
- Station Name & Description
- Rail Availability: Status of rail connections.
- Type: Operational classification (e.g., Terminal, Hub).
3. Network Legs (Connections)
Transport routes connecting the nodes are visualized as lines.- Flow Animation: A subtle particle effect moves along the lines, indicating the direction and active status of the flow.
- Distance Calculation: The system automatically calculates and displays the distance (km) for each leg.
- Leg Details: Hovering over a line shows the route name, transport type, and exact distance.
Data Integration
The interactive map is powered by real-time data from thePublic Network API. This ensures that any change in the physical network—such as a new terminal opening or a route suspension—is immediately reflected in the visualization without requiring frontend code changes.
Usage
This tool is primarily used by:- Logistics Planners: To visualize potential routing options and gaps.
- Sales Teams: To demonstrate network coverage to prospective clients in real-time.
- Management: For operational oversight and strategic planning.