Workflow Visualization
Key Features
Real-Time GPS Tracking
- Fetches live wagon locations from Nexxiot third-party API
- Displays GPS coordinates on interactive Leaflet map
- Auto-centers map on fleet location
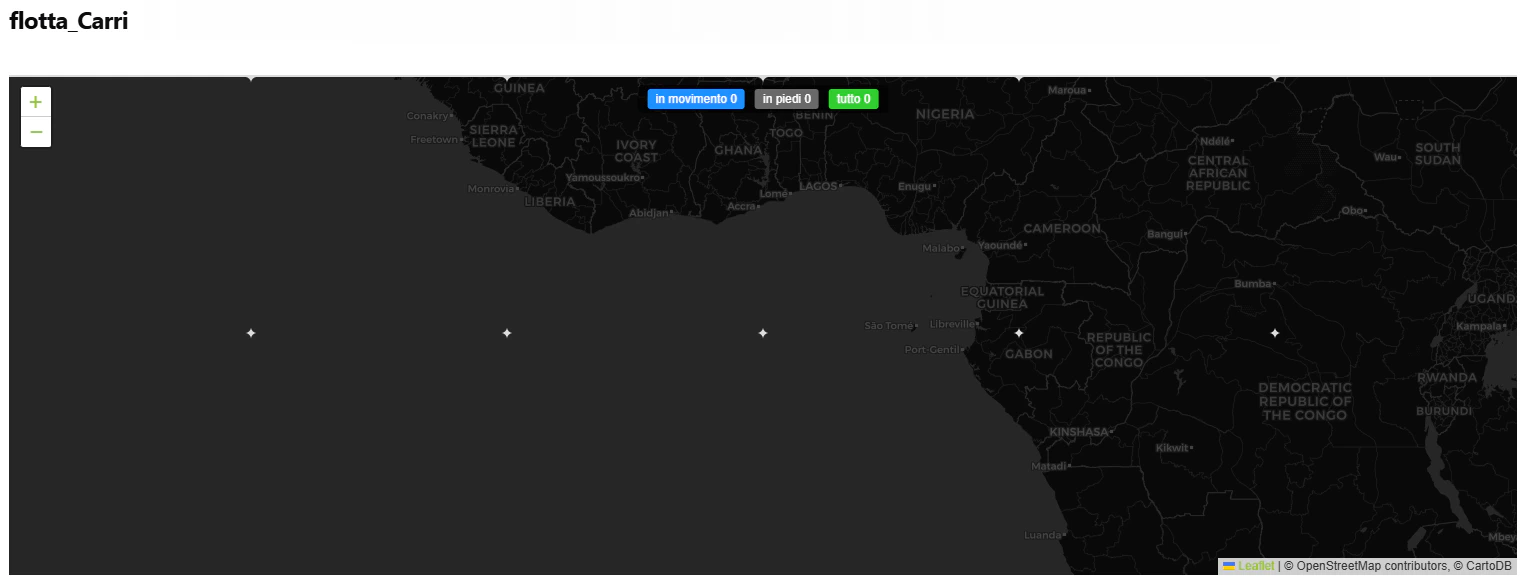
Movement Status Visualization
The dashboard provides immediate visual feedback on the operational state of the fleet:-
in movimento: Wagons currently in transit (Nexxiot detection).
-
in piedi: Wagons currently stationary at a node.
-
tutto: The total tracked inventory.
- Moving Wagons: Blue truck icons (🚚) with a pulsing animation for live identification.
- Standing Wagons: Gray static icons (🚚) representing idle or parked assets.
Interactive Map Controls
- Click Status Bar: Filter wagons by movement state
- Hover on Markers: View wagon details instantly
- Marker Clustering: Groups nearby wagons for cleaner visualization
- Zoom & Pan: Navigate across the entire fleet
Wagon Information
Each wagon marker displays:- EVN: Unique wagon identifier
- Type: Wagon type classification
- Status: Moving or Standing
- Location: Current address/display name
- Time: Last GPS measurement timestamp
How It Works
1
1. API Authentication
System authenticates with Nexxiot API to access GPS tracking data.2
2. Fetch Wagon Data
Retrieves all assets with:- GPS coordinates (latitude, longitude)
- Movement state (moving/standing)
- Wagon metadata (type, EVN)
- Location details and timestamps
3
3. Map Visualization
Renders interactive map with:- Moving wagons: Blue icons with pulse animation
- Standing wagons: Gray static icons
- Clustered markers for dense areas
- Status bar with live counts
4
4. User Interaction
Users can:- Filter by clicking status counts
- Hover for wagon details
- Zoom to specific regions
- Track individual wagons