1. Overview
Advanced Customer Data Analysis provides the strategic intelligence layer of the platform. By aggregating individual interaction points into visual trends, the platform fulfills the requirement to “identify trends, opportunities, and improve service and sales strategy.” This capability transforms raw customer statastics into actionable insights, enabling data-driven decision making.2. Scope and Business Meaning
Functionally, this deliverable covers the analytical interpretation of customer data. It ensures:- Trend Identification: The ability to visualize the movement of customers through the business lifecycle.
- Opportunity Recognition: Highlighting specific accounts or leads that require strategic intervention (“Qualified Lead” vs “Won”).
- Strategy Optimization: Using aggregated data to refine sales approaches and service delivery.
3. Implemented Functionalities
The platform implements the following functionalities to fulfill the “advanced analytical tools” requirement.Visual Pipeline Analytics (Sales Funnel)
Requirement Addressed: “Identify trends and opportunities” The Sales Funnel module serves as the primary analytical tool for customer data.- Stage Visualization: Customers are analyzed based on their lifecycle stage (Lead -> Qualified -> Won), revealing macro-trends in conversion efficacy.
- Opportunity Tracking: The visual distribution of opportunities allows for instant identification of bottlenecks or high-potential accounts.
- Reference: Sales Funnel
Granular Customer Analysis
Requirement Addressed: “Analyzing customer data” Beyond macro-trends, the platform analyzes data at the individual customer level.- Composition Analysis: Drill-down capabilities allow for the inspection of communication history, inquiry volume, and operational tasks per account.
- Data-Driven Profiling: The consolidation of these metrics provides a holistic view of the “Customer Health,” directly informing retention and upsell strategies.
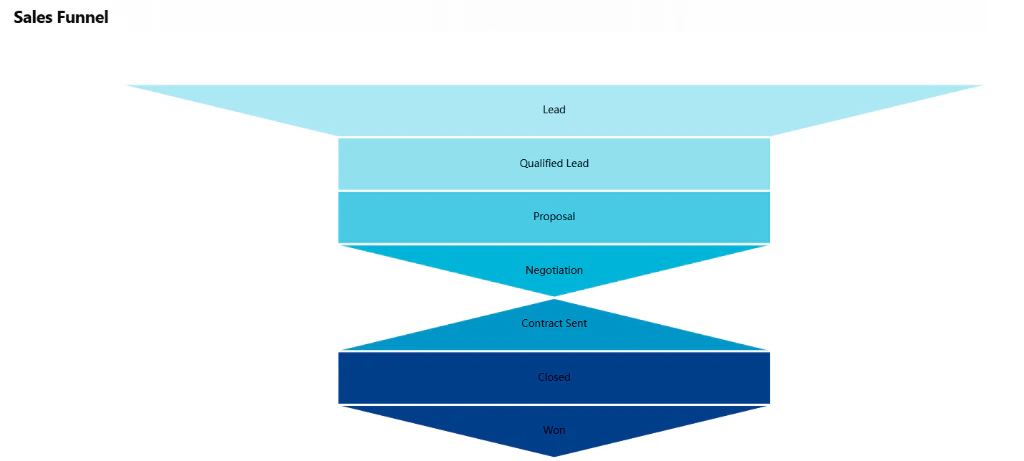
The AI Loop Sales Funnel visualizing current opportunities by stage.
4. Technical Enablement
The platform enables this deliverable through the following technical components:Data Aggregation Layer
db_ai-loop_V3_business: Stores the core entity data and current status flags.- Aggregation Logic: Backend services compute the real-time counts of entities per status (e.g.,
count(status='Qualified Lead')), feeding the visual widgets.
Visualization Engine
- Funnel Components: Frontend libraries render the aggregated data into interactive charts, allowing for the visual comparisons required for “trend identification.”