1. Overview
Custom Report Generation provides the analytical lens for the platform. It fulfills the requirement to “generate customized reports with visualization of KPIs and performance trends”, enabling stakeholders to monitor business health and make informed, data-driven decisions.2. Scope and Business Meaning
Functionally, this deliverable covers the business intelligence (BI) layer of the platform. It ensures:- Performance Monitoring: Real-time tracking of critical metrics (Revenue, Lead Conversion).
- Trend Visualization: Graphic representation of data to identify patterns over time.
- Data Aggregation: Consolidating data from Offers, Contracts, and Customers into a single view.
3. Implemented Functionalities
The platform implements the following functionalities to fulfill the “custom report” requirement.KPI Visualization
Requirement Addressed: “Visualization of KPIs” The Analytics & Reports module provides a dynamic dashboard for tracking Key Performance Indicators:- Financial Metrics: Real-time calculation of Annual Revenue based on won contracts.
- Operational Metrics: Tracking of Open Tasks and Success Rate (Conversion %). Refer: Analytics & Reports
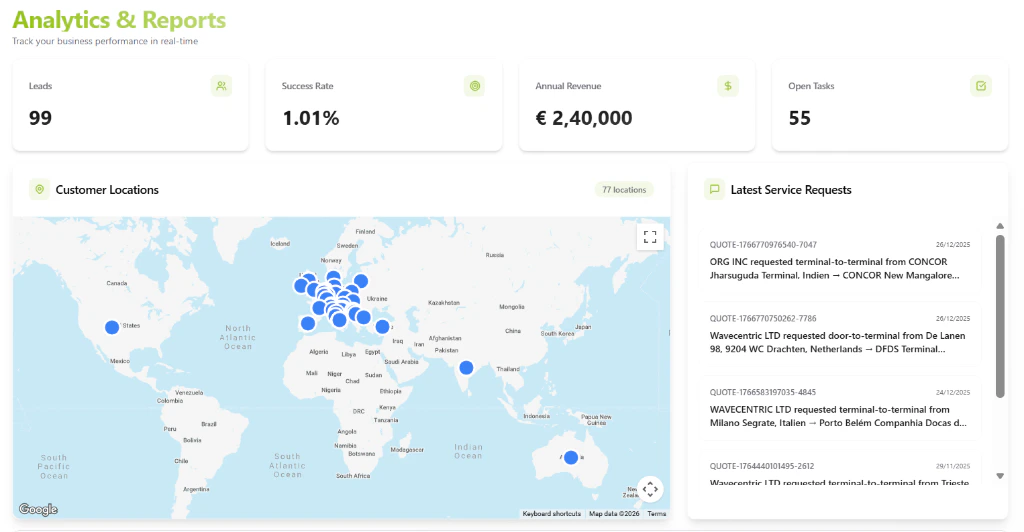
The Analytics dashboard displaying real-time KPIs and geographic performance reports.
Performance Trends
Requirement Addressed: “Performance trends” The system visualizes operational performance through:- Geographic Intelligence: Map-based visualization of customer distribution and activity density.
- Lead Volume: Tracking the influx of new business opportunities over time.
4. Technical Enablement
The platform enables this deliverable through:Real-Time Aggregation
AnalyticsService: A dedicated background service that continuously aggregates data fromCRM_Inquiries,Quotation, andTaskscollections.- Dynamic Computation: KPIs like “Success Rate” are computed on-the-fly to ensure 100% accuracy.