1. Overview
Advanced and Customizable Reporting provides comprehensive analytical capabilities for procurement intelligence. This deliverable addresses the need to “allow the generation of customizable reports for the analysis of logistics performance, costs, offers, and relationships with suppliers.” This capability is critical for continuous analysis and evidence-based decision-making in procurement operations.2. Scope and Business Meaning
Functionally, this deliverable covers the Reporting & Analytics layer. It ensures:- Performance Visibility: Comprehensive reporting on logistics operations and procurement efficiency.
- Cost Intelligence: Detailed analysis of procurement costs and financial performance.
- Supplier Insights: Analytical views of supplier relationships and interaction patterns.
3. Implemented Functionalities
The platform implements “Advanced and Customizable Reporting” through the Quotation Management Dashboard with integrated reporting and analytics capabilities.Performance Reporting
Requirement Addressed: “Analysis of logistics performance” The dashboard provides comprehensive performance reports:- Total Requests Report: Aggregate view of all quotation requests enabling volume-based performance analysis.
- Daily Activity Reports: Today’s requests metric providing operational tempo insights.
- Weekly Activity Trends: Time-series visualization showing request patterns for performance trend analysis.
- Workflow Efficiency: Track progression from requests through cost calculation to delivery. Refer: Quotation Management
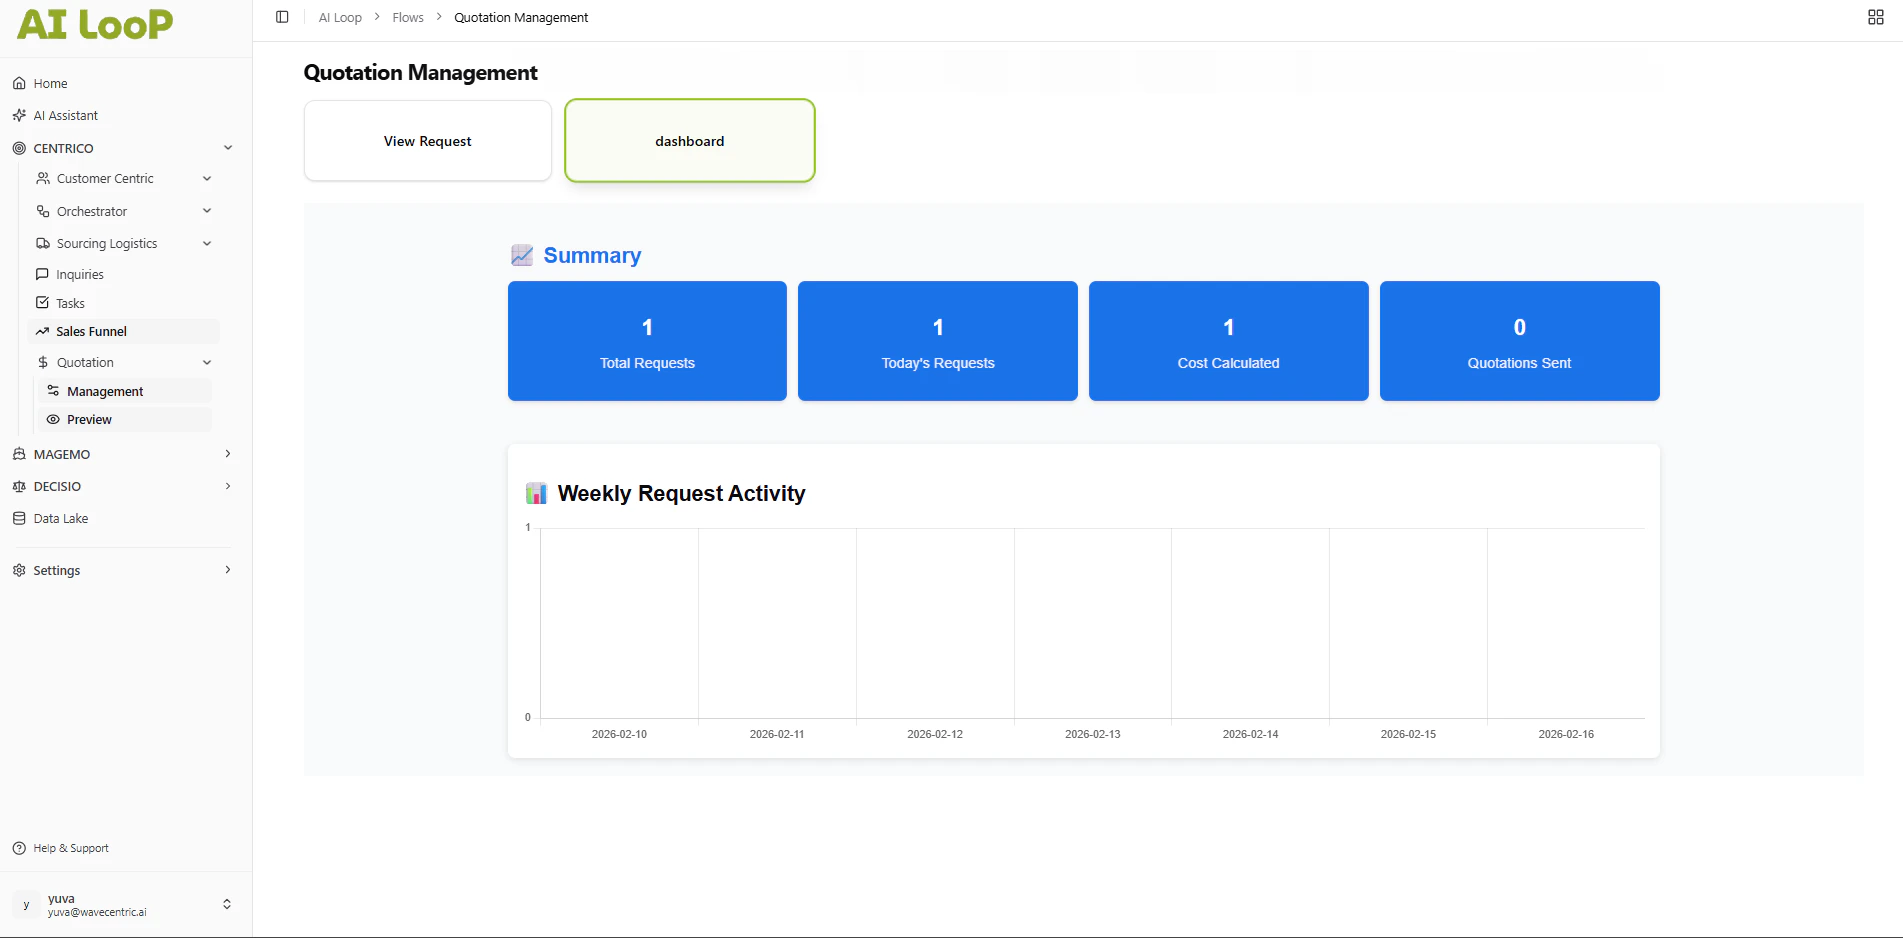
The KPI dashboard providing customizable reporting on logistics performance and costs.
Cost Analysis Reporting
Requirement Addressed: “Analysis of costs and offers” The system generates detailed cost reports:- Cost Calculation Reports: Number of quotes with completed cost analysis for pricing efficiency tracking.
- Quotation Delivery Reports: Track sent quotations for conversion analysis and offer management.
- Cost-Conversion Analysis: Compare calculated costs to delivered quotations for process optimization.
- Temporal Cost Trends: Weekly activity data supporting cost pattern identification.
Supplier Relationship Reporting
Requirement Addressed: “Relationships with suppliers” The platform provides supplier analytics:- Customer Interaction Reports: Track quotation requests by customer/supplier for relationship analysis.
- Response Pattern Reports: Monitor quotation delivery rates per supplier.
- Volume-Based Analysis: Analyze request volumes to identify key supplier relationships.
- Historical Supplier Trends: Weekly activity charts showing supplier engagement patterns over time.
4. Technical Enablement
The platform enables this deliverable through:Reporting Infrastructure
- Dashboard Analytics: Centralized reporting interface with four key KPIs (Total Requests, Today’s Requests, Cost Calculated, Quotations Sent).
- Metrics Engine: Automated calculation and aggregation of performance, cost, and supplier metrics.
- Visualization Components: Chart components rendering weekly activity trends for temporal analysis.
Customization Capabilities
- Temporal Filtering: Weekly activity chart enabling customizable time-range reporting.
- Direct Access: Dashboard link for immediate report access.
- Real-Time Updates: Metrics refresh automatically supporting current state reporting.