1. Overview
Service Performance Monitoring provides the operational pulse of the platform. It fulfills the requirement to “monitor service performance in real-time”, enabling the business not only to react to issues but to proactively identify inefficiencies in both customer management and procurement processes.2. Scope and Business Meaning
Functionally, this deliverable covers the efficiency optimization layer. It ensures:- Operational Visibility: Instant insight into the volume and status of ongoing service requests.
- Process Health: Identifying bottlenecks by tracking “Open Tasks” and conversion rates.
- Strategic Alignment: Using data to align procurement strategies with actual customer demand patterns.
3. Implemented Functionalities
The platform implements the following functionalities to fulfill the “service performance monitoring” requirement.Real-time Operational Metrics
Requirement Addressed: “Monitor service performance in real time” The Analytics & Reports dashboard serves as the central monitoring station:- Throughput Tracking: The Leads and Annual Revenue KPIs provide a real-time gauge of business volume and financial performance.
- Efficiency Indicators: The Success Rate metric highlights the effectiveness of the commercial team in converting inquiries to contracts. Refer: Analytics & Reports
Optimization Intelligence
Requirement Addressed: “Identify any areas for improvement… in procurement” By visualizing data spatially and temporally, the system highlights inefficiencies:- Demand Heatmaps: The Customer Locations map reveals geographic clusters of high activity, allowing for optimized procurement of carrier capacity in those regions.
- Bottleneck Detection: The Open Tasks metric identifies backlogs in the execution pipeline, signaling areas where resource allocation needs improvement.
4. Technical Enablement
The platform enables this deliverable through:Streaming Analytics
StreamProcessor: A backend component that ingests events (e.g., “Inquiry Created”, “Task Completed”) in real-time.- Aggregation Pipeline: Pre-calculates performance metrics every 60 seconds to ensure dashboard dashboards are always reflective of the current state.
5. Evidence of Delivery
The following evidence demonstrates strict compliance with the CCM 11 requirement: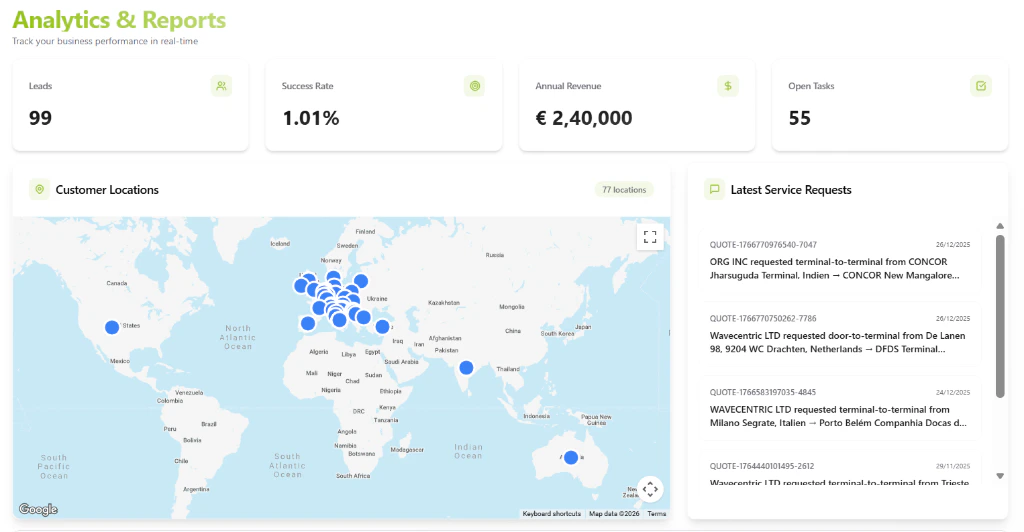
The Dashboard providing real-time visibility into operational efficiency and service performance.