1. Overview
Data Visualization and Custom Reports is the business intelligence layer that transforms raw logistics data into actionable insights. It fulfills the requirement to “allow users to generate customized reports on logistics data and display information in graphical format for quick analysis and decision.” This is important for providing a clear and visible overview of logistics operations, enabling users to understand performance trends and make informed strategic decisions.2. Scope and Business Meaning
Functionally, this deliverable covers the Analytics & Reporting layer. It ensures:- Custom Report Generation: Users can filter and export logistics data in customized formats.
- Visual Analytics: Graphical representation of key metrics for rapid comprehension.
- Personalized Dashboards: Modular widget-based interface tailored to individual user needs.
3. Implemented Functionalities
The platform implements “Data Visualization and Custom Reports” through three integrated systems: Data Lake Manager, Analytics & Reports, and Dashboard Personalization.Data Lake Manager - Custom Report Generation
Requirement Addressed: “Generate customized reports on logistics data” The Data Lake provides comprehensive data filtering and export capabilities:- Cross-Column Search: Instantly find records by searching across any business field simultaneously.
- Advanced Filtering: Use field-specific probes to isolate data based on precise criteria.
- Temporal Analysis: Integrated date-time pickers for precise time-based auditing and historical reporting.
- Bulk Export: Download any filtered view or entire collection as CSV for external analysis. Refer: Data Lake Manager
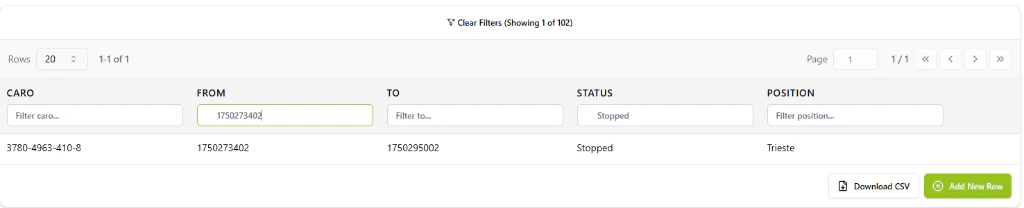
The Data Lake filtering system with integrated date-time pickers for custom report generation.
Analytics & Reports - Graphical Visualization
Requirement Addressed: “Display information in graphical format for quick analysis” Real-time visual analytics dashboard providing graphical insights:- Key Performance Indicators: Dynamic cards tracking Leads, Success Rate, Annual Revenue, and Open Tasks.
- Geographic Intelligence: Interactive map visualization of customer locations and regional density.
- Real-Time Operational Logging: Historical feed of incoming logistics requirements with instant synchronization.
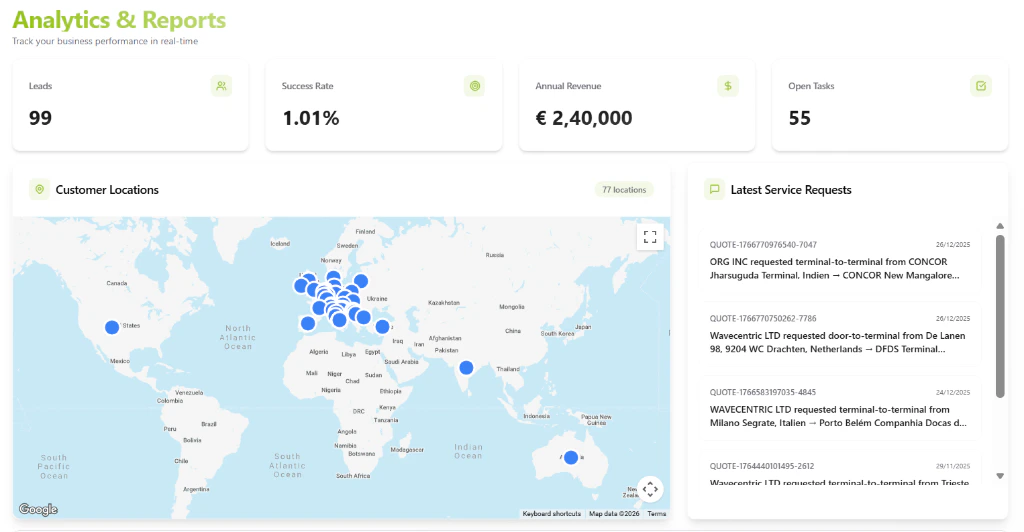
The Analytics dashboard featuring real-time KPIs and geographic visualization.
Dashboard Personalization - Custom Views
Requirement Addressed: “Clear and visible overview of logistics operations” Modular widget-based dashboard for personalized operational visibility:- Widget Registry: AI Queries, Open Tasks, Updates, Clients, Weather, Current Time, My Company, Instance Info, About Me.
- Live State Updates: Real-time counters and notifications without manual refresh.
- Rich Interaction: Embedded links and deep-linking to relevant data records.
- AI Queries: Quick AI-powered insights from home screen
- Open Tasks: Live snapshot of pending assignments
- Updates: Notification hub for system alerts and status changes
- Clients: Quick-access to frequent business partners
- Weather: Real-time weather data for operations
- Current Time: Precision clock with timezone context
- My Company: Organization details and verified status
- Instance Info: Technical operational environment context
- About Me: User profile summary
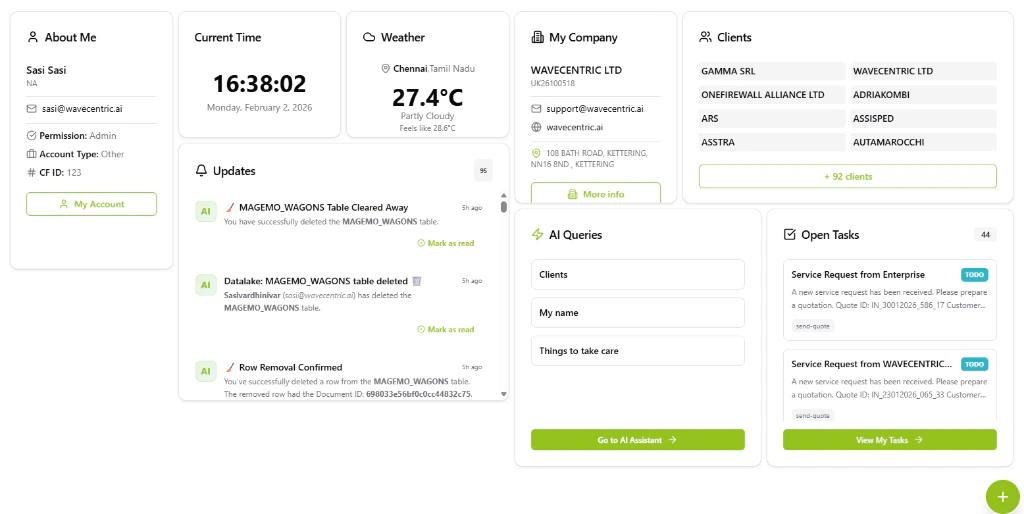
The customizable Dashboard with modular widgets for personalized operational views.
4. Technical Enablement
The platform enables this deliverable through:Data Lake Architecture
- Cross-Collection Search: Unified query engine capable of searching across all database collections simultaneously.
- Export Engine: CSV generation from any filtered dataset for external reporting tools.
- Schema Flexibility: Support for manual database creation and file-based ingestion (CSV, XLSX, XLS).
Analytics Engine
- Real-Time Aggregation: Live calculation of business metrics from operational databases.
- Google Maps Integration: Geospatial visualization for customer location intelligence.
- Visual Components: Dynamic KPI cards with automatic metric updates.
Dashboard Framework
- Widget System: Modular, drag-and-drop widget architecture for custom layouts.
- State Management: Real-time synchronization of widget data across the platform.
- Responsive Design: Adaptive layouts supporting various screen sizes and preferences.